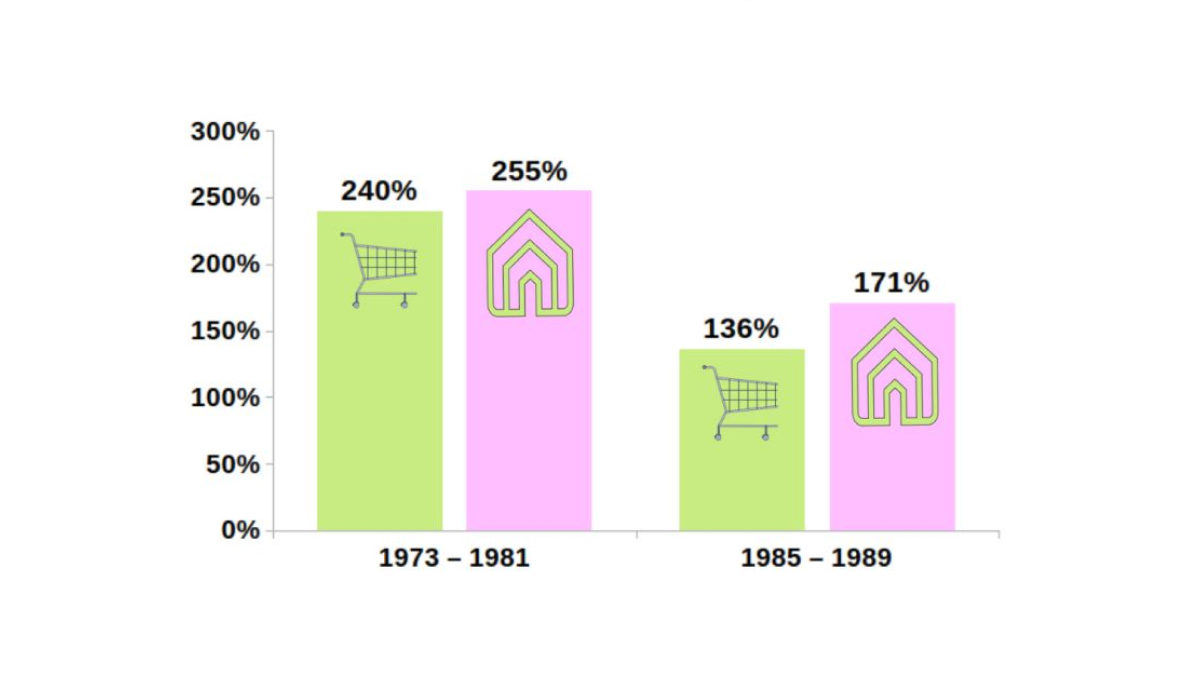
Australian house prices have grown substantially since 1973. The 7 city combined Australian median house value was $21,400 in 1973. 50 years later, in February 2023 the same combined 7 city median house value has increased to $914,750.
The nominal dollar value of housing has increased by approximately 43 times since 1973. Any analysis would be disingenuous if the comparison was made in nominal dollars. Clearly, inflation, or changes in the prices of goods and services, is a big part of the overall change in house prices.
Inflation over that same 50 years has increased overall prices by approximately 12 times. So what is the ‘real change’ in house prices? If we inflate 1973 house prices by the value of the average price of goods and services, the median value of a house across the combined capitals would be approximately $250,000. This means the real value of houses has increased by approximately. 3.6 times across the last 50 years.
What about during periods of inflation? Examining time periods of inflation with annual growth of more than 7% (last year’s threshold) 1973-1981 and 1985-1989. In all of these years, annual inflation in the year to December exceeded 7%.
House prices grew from $21,400 in 1973 to $54,500 in 1981. However, once we adjust for prices, the real value of 1973 house price in 1981 dollars would have been $51,300. A real growth of 6%.
In 1985, house prices were $60,750, and increased to $103,750 in 1989. If we adjust 1985 prices by inflation, they increase to approximately $82,750. A real house price growth of approximately 25% over the high inflation environment.
So history tells us house prices do tend to at least keep pace with or exceed inflation during periods of inflation similar to what we are experiencing now. History is not a guarantee of growth in house prices but a guide that it may perform well as a hedge during periods of high inflation. Visit Our Leg Up to find out more


Leave a Reply